SaaS Analytics Platform: Empowering decision-makers with a custom real-time visualization engine.

01 / The Obstacle
Heavy data pipelines caused severe browser lag. Enterprise clients were unable to render real-time charts with more than 10,000 concurrent data points.
The previous application structured real-time metrics using heavy SVG nodes within standard React renders. This completely blocked the main browser thread during extensive reporting generation.
Network payloads were over-fetching massive historical datasets instead of streaming real-time situational changes, triggering extreme server computational bills.
02 / Our Strategy
Implemented canvas-based rendering alongside GraphQL subscriptions, dropping data fetch latency to sub-100ms and ensuring flawless 60fps chart interactions.
We custom-built a hardware-accelerated Canvas engine inside React using raw D3.js coordinates, allowing effortless processing of up to 250,000 active telemetry streams.
GraphQL subscriptions were orchestrated to stream differential packets instead of full database clones, reducing client processing load to virtually nothing.
03 / Key Milestones
Interface Previews & Architecture Schematics
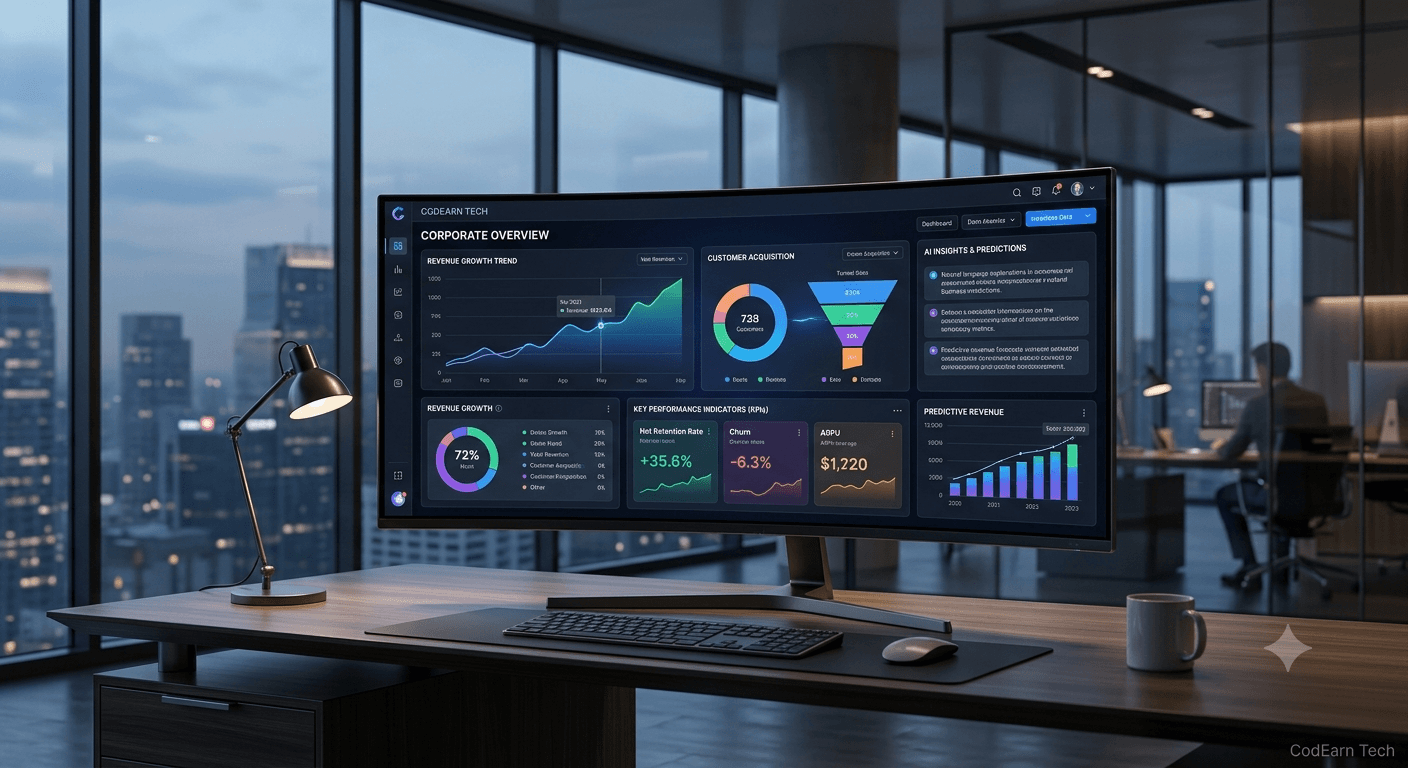
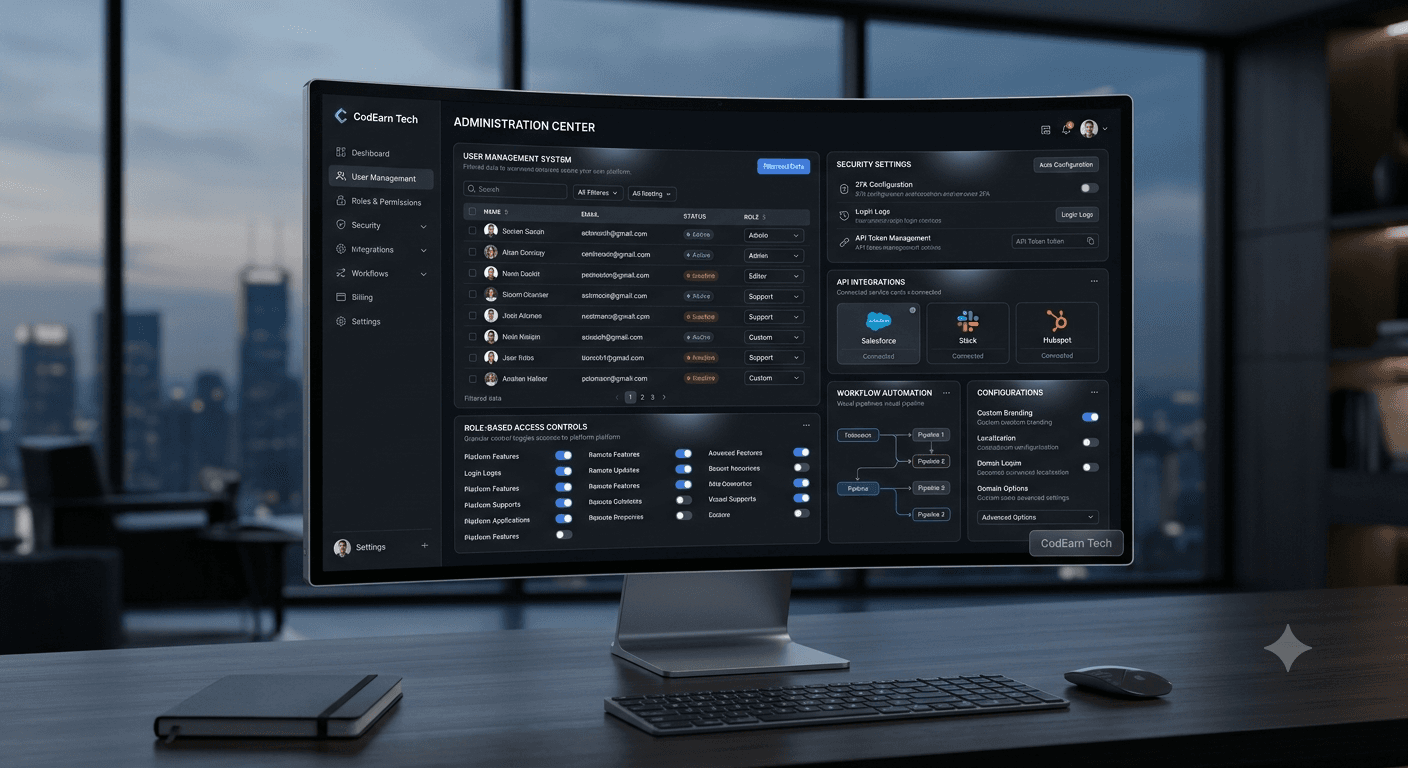
“The interface feels lightning fast. Our enterprise tier customers can now query multi-year metrics without a single millisecond of UI freezing.”

Ready to build something iconic together?
Let's engineer your vision into high-performance architecture.